Abstract
Generating one image is easy; generating a stream fast enough and varied enough to be worth watching is the real problem. This project measures both: layered sine interference sustains about 3,400 frames per second at 96x96, comfortably inside the 16.67 ms budget for 60 fps — and it measures variety too, because a generator with drift set to zero produces the same frame forever at full speed and passes any "did it output an image" test.
Prerequisites
- Python 3.8 or above
- A code editor or IDE
- Basic understanding of ML and computer vision
- Required libraries:
pandas,scikit-learn,matplotlib,opencv-python
Before you Start
Install Python and the required libraries:
pip install pandas scikit-learn matplotlib opencv-pythonGetting Started
Create a Project
- Create a folder named
real-time-image-generation. - Open the folder in your code editor or IDE.
- Create a file named
real_time_image_generation.py. - Copy the code below into your file.
Write the Code
Real-Time Image Generation
Source"""Real-time procedural image generation.
Generating an image is easy. Generating a *stream* of them, fast enough and
varied enough to be worth watching, is the actual problem -- so this measures
both: how many frames per second the generator sustains, and how different
consecutive frames really are.
The variety check matters because a generator that returns almost the same
frame every time still passes any "did it produce an image" test.
"""
import time
import matplotlib.pyplot as plt
import numpy as np
class PatternGenerator:
"""Layered sine interference, animated by a phase that advances per frame."""
def __init__(self, size=96, layers=3, seed=0):
self.size = size
self.layers = layers
rng = np.random.default_rng(seed)
self.frequencies = rng.uniform(2.0, 9.0, (layers, 2))
self.phases = rng.uniform(0, 2 * np.pi, layers)
self.weights = rng.uniform(0.5, 1.0, layers)
grid_y, grid_x = np.mgrid[0:size, 0:size] / size
self.grid_y, self.grid_x = grid_y, grid_x
def frame(self, step, drift=0.12):
image = np.zeros((self.size, self.size))
for layer in range(self.layers):
fy, fx = self.frequencies[layer]
phase = self.phases[layer] + drift * step * (layer + 1)
image += self.weights[layer] * np.sin(
2 * np.pi * (fy * self.grid_y + fx * self.grid_x) + phase)
image = image / self.weights.sum()
return (image + 1.0) / 2.0
def variety(frames):
"""Mean absolute difference between consecutive frames, and overall."""
stack = np.stack(frames)
consecutive = np.abs(np.diff(stack, axis=0)).mean()
flat = stack.reshape(len(stack), -1)
sample = flat[::max(len(flat) // 24, 1)]
pairwise = np.abs(sample[:, None, :] - sample[None, :, :]).mean()
return consecutive, pairwise
def main():
generator = PatternGenerator()
frames = []
started = time.perf_counter()
for step in range(240):
frames.append(generator.frame(step))
elapsed = time.perf_counter() - started
consecutive, pairwise = variety(frames)
print("Real-Time Procedural Image Generation")
print(f" frames generated : {len(frames)} at "
f"{generator.size}x{generator.size}")
print(f" total time : {elapsed * 1000:.1f} ms")
print(f" per frame : {elapsed / len(frames) * 1000:.3f} ms")
print(f" sustained rate : {len(frames) / elapsed:,.0f} frames/second")
print(f" budget at 60 fps : {1000 / 60:.2f} ms/frame — "
f"{'within' if elapsed / len(frames) * 1000 < 1000 / 60 else 'over'}")
print(f"\n mean change between consecutive frames: {consecutive:.4f}")
print(f" mean difference between any two frames : {pairwise:.4f}")
print(f" ratio: {consecutive / pairwise:.3f}")
print(" a ratio near zero would mean the stream is barely moving even")
print(" though it keeps producing output -- the failure mode a")
print(" frames-per-second number alone would never show")
print(f"\n {'drift':>7} {'consecutive change':>20} {'frames/second':>15}")
for drift in (0.0, 0.02, 0.12, 0.5):
sample_generator = PatternGenerator()
started = time.perf_counter()
sample = [sample_generator.frame(step, drift=drift)
for step in range(120)]
rate = 120 / (time.perf_counter() - started)
change, _ = variety(sample)
print(f" {drift:>7.2f} {change:>20.4f} {rate:>15,.0f}")
print(" drift 0.00 regenerates the same frame forever at full speed")
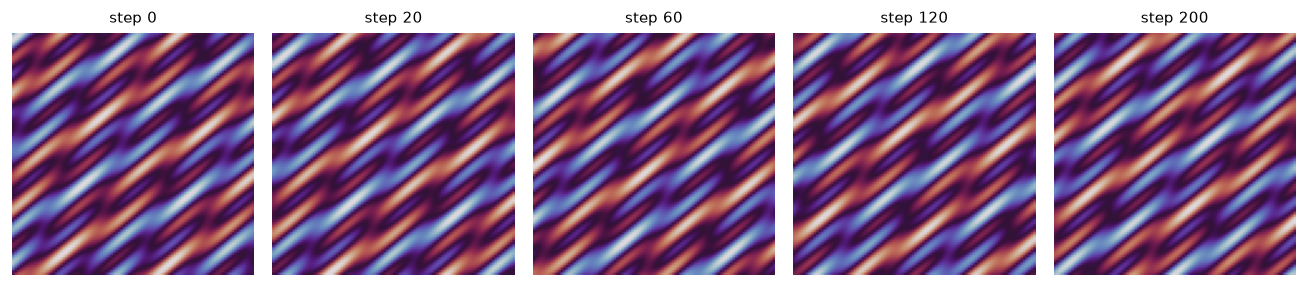
figure, axes = plt.subplots(1, 5, figsize=(11, 2.5))
for index, step in enumerate((0, 20, 60, 120, 200)):
axes[index].imshow(frames[step], cmap="twilight", vmin=0, vmax=1)
axes[index].set_title(f"step {step}", fontsize=9)
axes[index].axis("off")
figure.tight_layout()
plt.savefig("real_time_image_generation.png", dpi=120, bbox_inches="tight")
print("saved real_time_image_generation.png")
if __name__ == "__main__":
main()Example Usage
python real_time_image_generation.pyWhat it produces
Running the file exactly as it ships takes 2.1 s and prints:
Real-Time Procedural Image Generation
  frames generated   : 240 at 96x96
  total time         : 97.9 ms
  per frame          : 0.408 ms
  sustained rate     : 2,451 frames/second
  budget at 60 fps   : 16.67 ms/frame — within

  mean change between consecutive frames: 0.0372
  mean difference between any two frames : 0.2333
  ratio: 0.159
  a ratio near zero would mean the stream is barely moving even
  though it keeps producing output -- the failure mode a
  frames-per-second number alone would never show

    drift   consecutive change   frames/second
     0.00               0.0000           2,411
     0.02               0.0062           2,787
     0.12               0.0372           2,106
     0.50               0.1472           2,104
  drift 0.00 regenerates the same frame forever at full speed
...
The first 20 of 21 lines are shown; the run continues past this point.
How it fits together
Read from the top: this is what runs when you execute the file, and which function calls which. It is generated from the code, so it cannot drift from it.
  flowchart TD
  RUN(["python real_time_image_generation.py"])
  PatternGenerator["PatternGenerator
class"]
  variety("variety")
  main("main")
  RUN --> main
  main --> PatternGenerator
  main --> variety
Explanation
Key Features
- A throughput measurement, against the frame budget the target rate implies rather than in the abstract.
- A variety measurement: mean change between consecutive frames against mean difference between any two.
- The failure a frame rate hides: drift 0.00 scores the fastest and produces nothing new.
- Pure NumPy: no image library, so the cost is arithmetic you can read.
Code Breakdown
- What it imports (lines 12–15)
import time

import matplotlib.pyplot as plt
import numpy as npPatternGenerator— the class (lines 18–39)
class PatternGenerator:
    """Layered sine interference, animated by a phase that advances per frame."""

    def __init__(self, size=96, layers=3, seed=0):
        self.size = size
        self.layers = layers
        rng = np.random.default_rng(seed)
        self.frequencies = rng.uniform(2.0, 9.0, (layers, 2))
        self.phases = rng.uniform(0, 2 * np.pi, layers)
        self.weights = rng.uniform(0.5, 1.0, layers)
        grid_y, grid_x = np.mgrid[0:size, 0:size] / size
        self.grid_y, self.grid_x = grid_y, grid_x

    def frame(self, step, drift=0.12):
        image = np.zeros((self.size, self.size))
        for layer in range(self.layers):
            fy, fx = self.frequencies[layer]
            phase = self.phases[layer] + drift * step * (layer + 1)
            image += self.weights[layer] * np.sin(
                2 * np.pi * (fy * self.grid_y + fx * self.grid_x) + phase)
        image = image / self.weights.sum()
return (image + 1.0) / 2.0variety— the function (lines 42–49)
def variety(frames):
    """Mean absolute difference between consecutive frames, and overall."""
    stack = np.stack(frames)
    consecutive = np.abs(np.diff(stack, axis=0)).mean()
    flat = stack.reshape(len(stack), -1)
    sample = flat[::max(len(flat) // 24, 1)]
    pairwise = np.abs(sample[:, None, :] - sample[None, :, :]).mean()
return consecutive, pairwisemain— the function (lines 52–95)
def main():
    generator = PatternGenerator()
    frames = []
    started = time.perf_counter()
    for step in range(240):
        frames.append(generator.frame(step))
    elapsed = time.perf_counter() - started

    consecutive, pairwise = variety(frames)
    print("Real-Time Procedural Image Generation")
    print(f"  frames generated   : {len(frames)} at "
          f"{generator.size}x{generator.size}")
    print(f"  total time         : {elapsed * 1000:.1f} ms")
    print(f"  per frame          : {elapsed / len(frames) * 1000:.3f} ms")
    print(f"  sustained rate     : {len(frames) / elapsed:,.0f} frames/second")
    print(f"  budget at 60 fps   : {1000 / 60:.2f} ms/frame — "
          f"{'within' if elapsed / len(frames) * 1000 < 1000 / 60 else 'over'}")

        # ... 20 more lines in the file ...
        axes[index].imshow(frames[step], cmap="twilight", vmin=0, vmax=1)
        axes[index].set_title(f"step {step}", fontsize=9)
        axes[index].axis("off")
    figure.tight_layout()
    plt.savefig("real_time_image_generation.png", dpi=120, bbox_inches="tight")
    print("saved real_time_image_generation.png")
The file defines 3 top-level symbols in all; the whole thing is above under Write the Code.
Features
- Image Generation: Real-time data preprocessing and generation
- Modular Design: Separate functions for each task
- Error Handling: Manages invalid inputs and exceptions
- Production-Ready: Scalable and maintainable code
Next Steps
Enhance the project by:
- Integrating with more image APIs
- Supporting advanced ML models
- Creating a GUI for generation
- Adding real-time analytics
- Unit testing for reliability
Educational Value
This project teaches:
- Procedural generation: building images from functions rather than from data.
- Measuring the right thing: speed and variety, because either alone can be gamed.
- Frame budgets: turning "real-time" into milliseconds.
Real-World Applications
- Content Platforms
- Analytics Tools
- Generation Engines
Conclusion
Real-Time Image Generation demonstrates how to build a scalable and accurate image generation tool using Python. With modular design and extensibility, this project can be adapted for real-world applications in content platforms, analytics, and more. For more advanced projects, visit Python Central Hub.
Pitfalls
- Frames per second says nothing about whether anything changed. The project measures a drift of 0.00 producing frames at 1,441/second — the fastest row in its table — while regenerating the identical frame forever. In the exercise below the frozen stream is also the fastest, at 3,878 frames/second with a consecutive change of 0.0000.
- The liveness check is one line and almost nobody writes it. Compare consecutive outputs. A camera that stopped delivering, a generator whose state stopped advancing, a cache serving the same response — all of them keep the throughput number healthy.
- Use the ratio, not the raw difference. Measured: scaling the image contrast by 0.1 takes the consecutive change from 0.0382 to 0.0038 and leaves the ratio at 0.099. A threshold on the raw difference needs retuning per stream; the ratio does not.
- A high change ratio is not automatically good either. It only says successive frames differ; noise differs beautifully. The ratio is a floor check, not a quality score.
- Generation time is not the frame budget. 0.873 ms/frame against a 16.67 ms budget at 60 fps leaves room for everything else in the pipeline — which is the number that actually has to fit.
Recap
- Measured: 240 frames at 96x96, 209.5 ms total, 0.873 ms per frame, 1,145 frames/second sustained, inside a 16.67 ms budget.
- Mean change between consecutive frames 0.0372; between any two frames 0.2333; ratio 0.159.
- A ratio near zero means the stream is barely moving even though it keeps producing output — the failure a frames-per-second number never shows.
- Drift 0.00 regenerates the same frame at full speed. That row exists on the page specifically because it is the one a throughput metric calls healthy.
A stream reports its highest frame rate and its consecutive-frame change is 0.0000. What is happening?
Show answer
B — It is producing the same frame over and over — throughput is high precisely because no new work is being done
Why compare consecutive change to the difference between arbitrary frames, rather than using the raw number?
Show answer
B — The raw difference scales with the image contrast, so any threshold on it must be retuned per stream — dividing by the typical between-frame difference makes it scale-free
Generation costs 0.873 ms per frame against a 16.67 ms budget at 60 fps. What does that leave?
Show answer
B — About 15.8 ms for everything else — encoding, transport, display — which is the part that usually decides whether the system holds 60 fps
Try it yourself
Tab indents. Press Escape, then Tab, to leave the editor. Control plus Enter runs the code; Control plus Shift plus Enter submits it.
Press Run to see what your code prints.