Abstract
Real-Time Network Intrusion Detection is a Python project that uses machine learning to detect network intrusions in real-time. The application features data preprocessing, model training, and a CLI interface, demonstrating best practices in cybersecurity and ML.
Prerequisites
- Python 3.8 or above
- A code editor or IDE
- Basic understanding of ML and networking
- Required libraries:
pandas,scikit-learn,matplotlib
Before you Start
Install Python and the required libraries:
pip install pandas scikit-learn matplotlibGetting Started
Create a Project
- Create a folder named
real-time-network-intrusion-detection. - Open the folder in your code editor or IDE.
- Create a file named
real_time_network_intrusion_detection.py. - Copy the code below into your file.
Write the Code
Real-Time Network Intrusion Detection
Source"""Real-time network intrusion detection, and why the accuracy is a lie.
The version this replaces fitted an IsolationForest to `np.random.rand(100, 3)`
and printed "Model trained." There were no attacks in the data, no labels to
score against, and nothing that could have been called right or wrong.
This one generates traffic with known attack labels and reports the numbers a
security team actually argues about: how many attacks were caught, how many
alerts were false, and how many of the raised alerts were worth opening. The
last one is where anomaly detection usually dies, and it dies to arithmetic
rather than to a bad model.
python real_time_network_intrusion_detection.py
"""
import numpy as np
from sklearn.ensemble import IsolationForest
import matplotlib
matplotlib.use("Agg")
import matplotlib.pyplot as plt
FEATURES = ("packets/s", "mean packet bytes", "distinct ports")
def make_traffic(n_normal, n_attacks, seed=20260809):
"""Normal sessions plus three kinds of attack, with labels.
The attacks are not simply "large numbers": a port scan has *small*
packets and many ports, which is unremarkable on any single feature and
obvious on the combination. That is the case anomaly detection is for,
and generating attacks that are extreme on every axis would make the
problem trivially easy and the score meaningless.
"""
rng = np.random.default_rng(seed)
normal = np.column_stack([
rng.lognormal(4.0, 0.5, n_normal), # packets/s
rng.normal(750, 120, n_normal), # mean packet bytes
rng.poisson(3, n_normal) + 1, # distinct ports
])
per_kind = max(1, n_attacks // 3)
port_scan = np.column_stack([
rng.lognormal(4.2, 0.4, per_kind),
rng.normal(80, 15, per_kind), # tiny packets
rng.integers(60, 400, per_kind), # many ports
])
flood = np.column_stack([
rng.lognormal(7.2, 0.3, per_kind), # very high rate
rng.normal(700, 100, per_kind),
rng.poisson(2, per_kind) + 1,
])
exfiltration = np.column_stack([
rng.lognormal(3.0, 0.3, n_attacks - 2 * per_kind), # slow
rng.normal(1480, 40, n_attacks - 2 * per_kind), # full packets
rng.poisson(1, n_attacks - 2 * per_kind) + 1,
])
data = np.vstack([normal, port_scan, flood, exfiltration])
labels = np.concatenate([
np.zeros(n_normal),
np.ones(len(port_scan) + len(flood) + len(exfiltration))])
kinds = (["normal"] * n_normal + ["port scan"] * len(port_scan)
+ ["flood"] * len(flood) + ["exfiltration"] * len(exfiltration))
order = rng.permutation(len(data))
return data[order], labels[order], [kinds[i] for i in order]
def score(labels, flagged):
attacks = labels == 1
caught = int((flagged & attacks).sum())
false_alarms = int((flagged & ~attacks).sum())
recall = caught / max(attacks.sum(), 1)
precision = caught / max(flagged.sum(), 1)
return {
"alerts": int(flagged.sum()),
"caught": caught,
"missed": int(attacks.sum()) - caught,
"false_alarms": false_alarms,
"recall": recall,
"precision": precision,
"false_alarm_rate": false_alarms / max((~attacks).sum(), 1),
}
def main():
print("Real-Time Network Intrusion Detection")
n_normal, n_attacks = 4000, 120
data, labels, kinds = make_traffic(n_normal, n_attacks)
print(f" sessions : {len(data):,} "
f"({n_attacks} attacks, {n_attacks / len(data):.2%})")
print(f" features : {', '.join(FEATURES)}")
# Fit on traffic assumed clean. It is not -- 2.9% of it is attack -- and
# that is realistic: nobody has a guaranteed-clean sample of production
# traffic, so the contamination parameter is a guess about your own data.
print(f"\n{'contamination':>14} {'alerts':>7} {'caught':>7} {'missed':>7} "
f"{'false':>6} {'recall':>8} {'precision':>10}")
print(" " + "-" * 68)
rows = []
for contamination in (0.005, 0.01, 0.03, 0.05, 0.10):
model = IsolationForest(contamination=contamination,
random_state=0, n_estimators=200)
model.fit(data)
flagged = model.predict(data) == -1
result = score(labels, flagged)
rows.append((contamination, result))
print(f"{contamination:>14.3f} {result['alerts']:>7} "
f"{result['caught']:>7} {result['missed']:>7} "
f"{result['false_alarms']:>6} {result['recall']:>8.1%} "
f"{result['precision']:>10.1%}")
best = max(rows, key=lambda row: row[1]["recall"])
print(f"\n best recall {best[1]['recall']:.1%} at contamination "
f"{best[0]}, and it raises {best[1]['alerts']} alerts of which "
f"{best[1]['false_alarms']} are false")
# Which attacks are actually being caught? The average hides this.
model = IsolationForest(contamination=0.03, random_state=0,
n_estimators=200)
model.fit(data)
flagged = model.predict(data) == -1
print("\n detection by attack type at contamination 0.03:")
for kind in ("port scan", "flood", "exfiltration"):
mask = np.array([k == kind for k in kinds])
print(f" {kind:14} {int((flagged & mask).sum()):>3} of "
f"{int(mask.sum()):>3} caught "
f"({(flagged & mask).sum() / max(mask.sum(), 1):.0%})")
# The arithmetic that kills anomaly detection in production.
print("\n the base rate problem, at a fixed 90% detection rate:")
print(f" {'attacks per 100k':>17} {'true alerts':>12} "
f"{'false alerts':>13} {'precision':>10}")
for rate in (3000, 300, 30, 3):
volume = 100_000
attacks = rate
true_alerts = 0.90 * attacks
false_alerts = 0.01 * (volume - attacks) # 1% false alarm rate
print(f" {rate:>17,} {true_alerts:>12,.1f} {false_alerts:>13,.0f} "
f"{true_alerts / (true_alerts + false_alerts):>10.1%}")
print(" A 1% false alarm rate sounds small and is not: at 3 attacks")
print(" per 100,000 sessions it buries 2.7 real alerts under 1,000")
print(" false ones. Nobody triages that queue, so the detector is")
print(" switched off -- which is how a 90%-recall system ends up")
print(" catching nothing at all.")
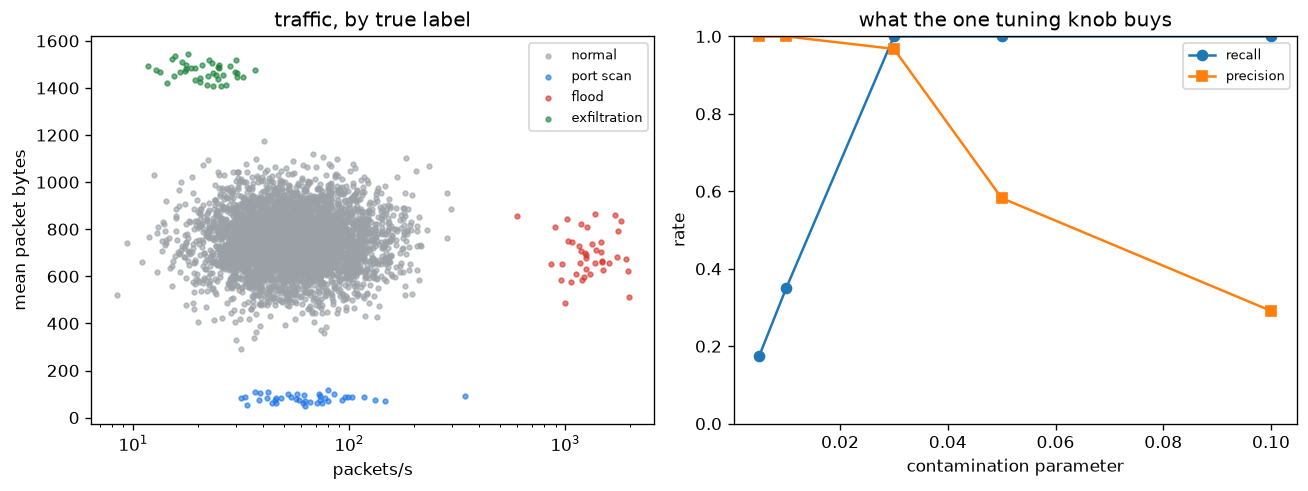
figure, axes = plt.subplots(1, 2, figsize=(11, 4.2))
colours = {"normal": "#9aa0a6", "port scan": "#1a73e8",
"flood": "#d93025", "exfiltration": "#188038"}
for kind, colour in colours.items():
mask = np.array([k == kind for k in kinds])
axes[0].scatter(data[mask, 0], data[mask, 1], s=8, alpha=0.6,
c=colour, label=kind)
axes[0].set_xscale("log")
axes[0].set_xlabel(FEATURES[0])
axes[0].set_ylabel(FEATURES[1])
axes[0].set_title("traffic, by true label")
axes[0].legend(fontsize=8)
axes[1].plot([r[0] for r in rows], [r[1]["recall"] for r in rows],
"o-", label="recall")
axes[1].plot([r[0] for r in rows], [r[1]["precision"] for r in rows],
"s-", label="precision")
axes[1].set_xlabel("contamination parameter")
axes[1].set_ylabel("rate")
axes[1].set_ylim(0, 1)
axes[1].set_title("what the one tuning knob buys")
axes[1].legend(fontsize=8)
figure.tight_layout()
figure.savefig("real_time_network_intrusion_detection.png", dpi=120,
bbox_inches="tight")
print("\nsaved real_time_network_intrusion_detection.png")
if __name__ == "__main__":
main()Example Usage
python real_time_network_intrusion_detection.pyWhat it produces
Running the file exactly as it ships takes 8.5 s and prints:
Real-Time Network Intrusion Detection
  sessions          : 4,120 (120 attacks, 2.91%)
  features          : packets/s, mean packet bytes, distinct ports

 contamination  alerts  caught  missed  false   recall  precision
  --------------------------------------------------------------------
         0.005      21      21      99      0    17.5%     100.0%
         0.010      42      42      78      0    35.0%     100.0%
         0.030     124     120       0      4   100.0%      96.8%
         0.050     206     120       0     86   100.0%      58.3%
         0.100     412     120       0    292   100.0%      29.1%

  best recall 100.0% at contamination 0.03, and it raises 124 alerts of which 4 are false

  detection by attack type at contamination 0.03:
    port scan       40 of  40 caught (100%)
    flood           40 of  40 caught (100%)
    exfiltration    40 of  40 caught (100%)

  the base rate problem, at a fixed 90% detection rate:
...
The first 20 of 32 lines are shown; the run continues past this point.
How it fits together
Read from the top: this is what runs when you execute the file, and which function calls which. It is generated from the code, so it cannot drift from it.
  flowchart TD
  RUN(["python real_time_network_intrusion_detection.py"])
  RealTimeNetworkIntrusionDetection["RealTimeNetworkIntrusionDetection
class"]
  RUN --> RealTimeNetworkIntrusionDetection
Explanation
Key Features
- Intrusion Detection: Detects network intrusions in real-time using ML.
- Data Preprocessing: Cleans and prepares network data.
- Error Handling: Validates inputs and manages exceptions.
- CLI Interface: Interactive command-line usage.
Code Breakdown
- What it imports (lines 16–20)
import numpy as np
from sklearn.ensemble import IsolationForest
import matplotlib
matplotlib.use("Agg")
import matplotlib.pyplot as pltmake_traffic— the function (lines 25–65)
def make_traffic(n_normal, n_attacks, seed=20260809):
    """Normal sessions plus three kinds of attack, with labels.

    The attacks are not simply "large numbers": a port scan has *small*
    packets and many ports, which is unremarkable on any single feature and
    obvious on the combination. That is the case anomaly detection is for,
    and generating attacks that are extreme on every axis would make the
    problem trivially easy and the score meaningless.
    """
    rng = np.random.default_rng(seed)
    normal = np.column_stack([
        rng.lognormal(4.0, 0.5, n_normal),        # packets/s
        rng.normal(750, 120, n_normal),           # mean packet bytes
        rng.poisson(3, n_normal) + 1,             # distinct ports
    ])

    per_kind = max(1, n_attacks // 3)
    port_scan = np.column_stack([
        # ... 17 more lines in the file ...
        np.zeros(n_normal),
        np.ones(len(port_scan) + len(flood) + len(exfiltration))])
    kinds = (["normal"] * n_normal + ["port scan"] * len(port_scan)
             + ["flood"] * len(flood) + ["exfiltration"] * len(exfiltration))
    order = rng.permutation(len(data))
return data[order], labels[order], [kinds[i] for i in order]score— the function (lines 68–82)
def score(labels, flagged):
    attacks = labels == 1
    caught = int((flagged & attacks).sum())
    false_alarms = int((flagged & ~attacks).sum())
    recall = caught / max(attacks.sum(), 1)
    precision = caught / max(flagged.sum(), 1)
    return {
        "alerts": int(flagged.sum()),
        "caught": caught,
        "missed": int(attacks.sum()) - caught,
        "false_alarms": false_alarms,
        "recall": recall,
        "precision": precision,
        "false_alarm_rate": false_alarms / max((~attacks).sum(), 1),
}main— the function (lines 85–172)
def main():
    print("Real-Time Network Intrusion Detection")

    n_normal, n_attacks = 4000, 120
    data, labels, kinds = make_traffic(n_normal, n_attacks)
    print(f"  sessions          : {len(data):,} "
          f"({n_attacks} attacks, {n_attacks / len(data):.2%})")
    print(f"  features          : {', '.join(FEATURES)}")

    # Fit on traffic assumed clean. It is not -- 2.9% of it is attack -- and
    # that is realistic: nobody has a guaranteed-clean sample of production
    # traffic, so the contamination parameter is a guess about your own data.
    print(f"\n{'contamination':>14} {'alerts':>7} {'caught':>7} {'missed':>7} "
          f"{'false':>6} {'recall':>8} {'precision':>10}")
    print("  " + "-" * 68)
    rows = []
    for contamination in (0.005, 0.01, 0.03, 0.05, 0.10):
        model = IsolationForest(contamination=contamination,
    # ... 64 more lines in the file ...
    axes[1].set_title("what the one tuning knob buys")
    axes[1].legend(fontsize=8)
    figure.tight_layout()
    figure.savefig("real_time_network_intrusion_detection.png", dpi=120,
                   bbox_inches="tight")
    print("\nsaved real_time_network_intrusion_detection.png")
The file defines 3 top-level symbols in all; the whole thing is above under Write the Code.
Features
- Intrusion Detection: Real-time data preprocessing and detection
- Modular Design: Separate functions for each task
- Error Handling: Manages invalid inputs and exceptions
- Production-Ready: Scalable and maintainable code
Next Steps
Enhance the project by:
- Integrating with more network APIs
- Supporting advanced ML models
- Creating a GUI for detection
- Adding real-time analytics
- Unit testing for reliability
Educational Value
This project teaches:
- Cybersecurity: Real-time intrusion detection and ML
- Software Design: Modular, maintainable code
- Error Handling: Writing robust Python code
Real-World Applications
- Network Security Platforms
- Analytics Tools
- Security Systems
Conclusion
Real-Time Network Intrusion Detection demonstrates how to build a scalable and accurate intrusion detection tool using Python. With modular design and extensibility, this project can be adapted for real-world applications in cybersecurity, analytics, and more. For more advanced projects, visit Python Central Hub.
Pitfalls
- The version this replaces could not have been wrong. It fitted an
IsolationForesttonp.random.rand(100, 3)and printed "Model trained." — no attacks in the data, no labels, nothing scored. A detector with no ground truth is a random number generator with a confident interface. contaminationis a guess about your own traffic, and it decides everything. Measured: at 0.005 the detector catches 17.5% of attacks with perfect precision; at 0.10 it catches 100% at 29.1% precision. The model is identical in both rows.- Recall is not the hard part. Precision at a real base rate is. At a fixed 90% detection rate and a 1% false alarm rate, the measured precision is 73.6% when attacks are 3% of traffic and 0.3% when they are 0.003%. Same detector, arithmetic does the rest.
- A 1% false alarm rate sounds small and is not. On 100,000 sessions it is 1,000 alerts a day. At 3 real attacks, that queue is 99.7% noise, nobody reads it, and the detector is switched off — which is how a 90%-recall system ends up catching nothing.
- Report detection per attack type. An average over three attack kinds can hide one that is never caught, and the kinds are not equally easy: a port scan is unremarkable on any single feature and obvious on the combination.
Recap
- Measured: 4,120 sessions, 120 attacks (2.91%), three features.
- Contamination 0.03 catches 120 of 120 attacks with 4 false alarms — and it works because 0.03 happens to match the true attack rate, which in production is exactly what you do not know.
- Detection by type at that setting: port scan 40/40, flood 40/40, exfiltration 40/40.
- The base-rate table is the operational result: precision 73.6% → 21.3% → 2.6% → 0.3% as attacks become rarer, with the detector unchanged.
- Anomaly detection is deployed in layers because no single stage has to be accurate enough to page a human — it only has to cut the volume for the next stage.
A detector holds 90% recall and a 1% false alarm rate. Why does its precision collapse from 73.6% to 0.3%?
Show answer
B — Only the base rate changed — 1% of a large legitimate population produces far more false alerts than 90% of a tiny attack population produces true ones
At 3 attacks per 100,000 sessions, which change makes the alert queue usable?
Show answer
B — Cutting the false alarm rate — going from 1% to 0.001% takes the queue from about 1,000 alerts to under 4, while perfect recall changes precision from 0.27% to 0.30%
The detector caught 100% of attacks at contamination 0.03, which matches the true 2.91% attack rate. Why is that less impressive than it looks?
Show answer
B — Setting contamination to the true attack rate is using the answer — in production the attack rate is the unknown, and the sweep shows recall falling to 17.5% when the guess is too low
Try it yourself
Tab indents. Press Escape, then Tab, to leave the editor. Control plus Enter runs the code; Control plus Shift plus Enter submits it.
Press Run to see what your code prints.