
Evaluating Models: Generalization and Validation
Every technique in this phase was judged by a validation number. This page is about whether that number means anything. Two failure modes matter: the score has too much variance to compare anything, or information from the test set has leaked into training and the score is fiction. Both are measured below, and the second one reached 0.9600 accuracy on data with no signal in it at all.
What you’ll learn
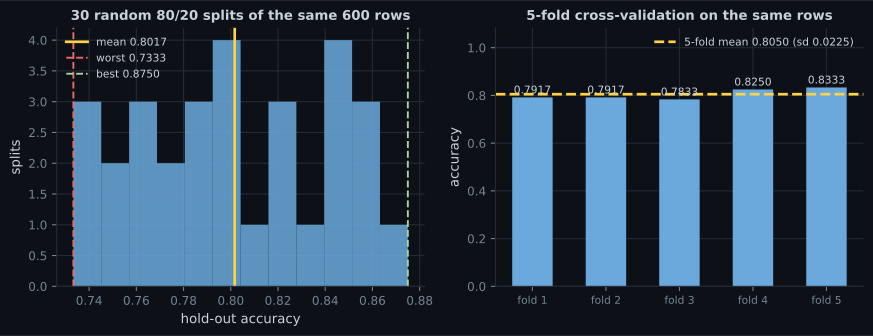
Section titled “What you’ll learn”- The spread across 30 random hold-out splits of the same data: 0.7333 to 0.8750, a range of 0.1417.
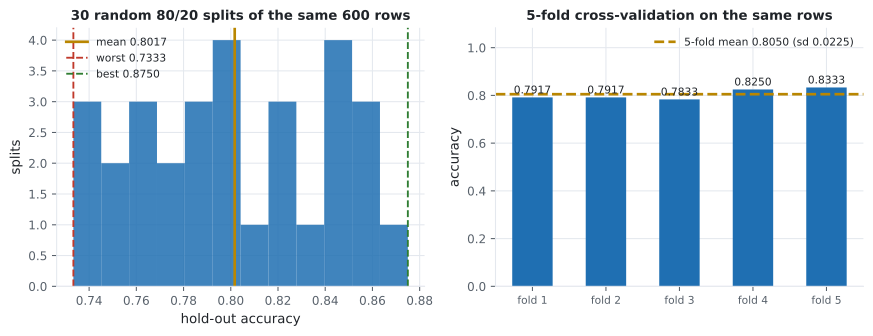
- Why K-fold cuts that: sd 0.0225 against 0.0407 for single splits.
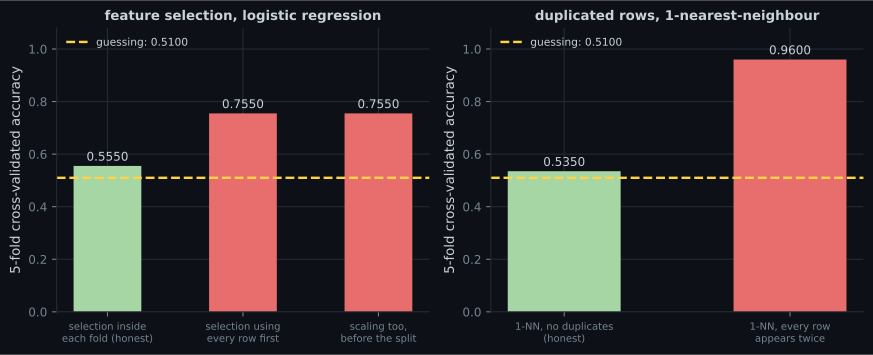
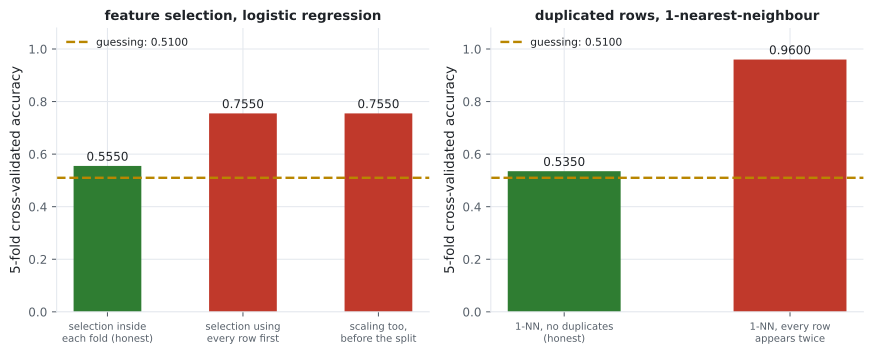
- Three information leaks measured on pure noise, where the honest answer is 0.5100: feature selection before the split gave 0.7550, and duplicated rows gave 0.9600.
- Why the duplicate-row leak only appears once the split is shuffled.
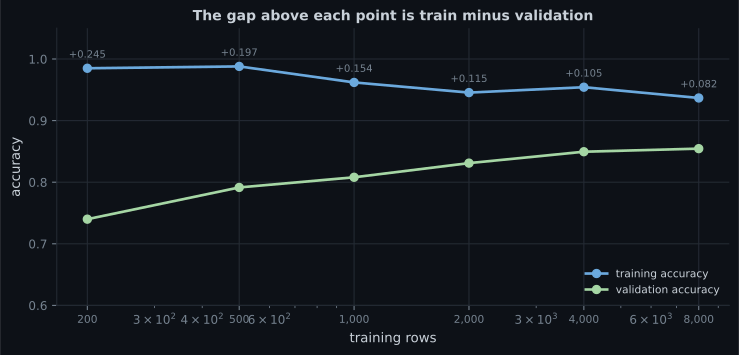
- How to read a learning curve: the train/validation gap falling from 0.2450 to 0.0822 as data grows 40×.
- When to use hold-out, K-fold, and iterated K-fold.
One split is not a measurement
Section titled “One split is not a measurement”600 rows, logistic regression, 80/20 hold-out, repeated 30 times with a different random split each time:
| Value | |
|---|---|
| mean across 30 splits | 0.8017 |
| standard deviation | 0.0407 |
| worst split | 0.7333 |
| best split | 0.8750 |
| range | 0.1417 |
Pick one split and report it, and you report a number drawn from that distribution. If you also tuned on that split, you have selected the split that flattered you.
Five-fold cross-validation on the identical rows:
| Fold | Accuracy |
|---|---|
| 1 | 0.7917 |
| 2 | 0.7917 |
| 3 | 0.7833 |
| 4 | 0.8250 |
| 5 | 0.8333 |
| mean | 0.8050 (sd 0.0225) |
K-fold does not remove the variance — the folds still disagree by 0.05 — but it halves the standard deviation and, more importantly, it reports the spread. A mean with no spread beside it is an incomplete result. The house-price page measured the same effect on 404 rows, where four folds disagreed by 0.8018 MAE.
  flowchart TD
  A["how much data?"] --> B{"tens of thousands
or more"}
  A --> C{"a few thousand"}
  A --> D{"a few hundred"}
  B --> E["simple hold-out
one split is enough"]
  C --> F["K-fold, K = 5
report mean and spread"]
  D --> G["iterated K-fold
repeat with new shuffles"]
  E --> H["plus a final test set
touched exactly once"]
  F --> H
  G --> H
Three ways to leak, measured on nothing
Section titled “Three ways to leak, measured on nothing”Build a dataset with no signal whatsoever: 200 rows, 2,000 standard-normal features, labels drawn at random. The honest cross-validated accuracy is chance — measured at 0.5100 for the majority class. Anything above that is leakage, because there is nothing to learn.
| Procedure | Cross-validated accuracy | Honest? |
|---|---|---|
| chance (majority class) | 0.5100 | — |
| feature selection inside each fold | 0.5550 | yes |
| feature selection using every row first | 0.7550 | no |
| scaling and selection before the split | 0.7550 | no |
| 1-NN, no duplicates | 0.5350 | yes |
| 1-NN, every row duplicated | 0.9600 | no |
Three lessons, in order of how often they bite:
- Any step that looks at the labels must live inside the fold. Feature selection is the classic case: choosing the 20 features most correlated with the labels, using all 200 rows, hands the model 20 features that are correlated with the validation labels by construction. The lift is 0.2450 out of pure noise.
- Scaling before the split leaks too, but much less.
StandardScaleruses no labels, so it only leaks the feature distribution. Here it added nothing on top of the selection leak — the measured 0.7550 is identical. It matters more when the test set is small or distributed differently. - Duplicate rows are the leak nobody looks for. Near-copies of the same record — the same customer twice, the same image resized, augmented copies made before splitting — put a test row’s twin in the training set. A model that can memorise then scores 0.9600 on noise.
The duplicate leak needs a shuffle
Section titled “The duplicate leak needs a shuffle”A useful detail: with contiguous (unshuffled) folds, duplicating each row in place does not leak at all, because both copies land in the same fold. The leak appears only when the split is shuffled — which is what you are told to do, and should do. Two safe practices, not one:
_, unique_rows = np.unique(x, axis=0, return_index=True)
x, y = x[np.sort(unique_rows)], y[np.sort(unique_rows)]
# and: split by group (customer, patient, document) when rows are related
Grouped splitting — GroupKFold in scikit-learn — is the general answer whenever
rows are not independent.
The learning curve tells you what to fix
Section titled “The learning curve tells you what to fix”Train the same model on growing subsets and record both accuracies:
| Training rows | Train accuracy | Validation accuracy | Gap |
|---|---|---|---|
| 200 | 0.9850 | 0.7400 | 0.2450 |
| 500 | 0.9880 | 0.7915 | 0.1965 |
| 1,000 | 0.9620 | 0.8080 | 0.1540 |
| 2,000 | 0.9455 | 0.8310 | 0.1145 |
| 4,000 | 0.9542 | 0.8495 | 0.1047 |
| 8,000 | 0.9367 | 0.8545 | 0.0822 |
Two diagnoses come straight off this table:
- A large gap that shrinks as data grows means the model is memorising and more data is the fix. That is the whole curve above: 40× the data closed two thirds of the gap.
- A flattening validation curve means more data has stopped paying. Between 4,000 and 8,000 rows — a doubling — validation gained 0.0050. At that point capacity, features or architecture are the cheaper levers.
If instead both curves are low and close together, the model is underfitting and more data will not help at all.
Three validation schemes
Section titled “Three validation schemes”x_val, y_val = x_train[:5000], y_train[:5000]
x_fit, y_fit = x_train[5000:], y_train[5000:]from sklearn.model_selection import KFold
for train_index, val_index in KFold(5, shuffle=True, random_state=0).split(x):
... # train a fresh model per fold, then average and report the spreadfrom sklearn.model_selection import RepeatedKFold
for train_index, val_index in RepeatedKFold(n_splits=5, n_repeats=3,
random_state=0).split(x):
... # 15 models; the standard error shrinks with the count| Scheme | Models trained | Use when |
|---|---|---|
| hold-out | 1 | tens of thousands of rows or more |
| K-fold (K=5) | 5 | a few thousand rows |
| iterated K-fold | K × repeats | a few hundred rows, or a decision that matters |
And regardless of the scheme: one final test set, evaluated once, after every decision is made. The validation score is contaminated by definition, because you used it to choose things. The IMDB page measured that gap directly: 0.8882 on validation at the chosen epoch, 0.8792 on the test set.
Pitfalls
Section titled “Pitfalls”- Reporting a single hold-out score. Thirty splits of the same data spanned 0.1417 here.
- Fitting a scaler, imputer or feature selector before splitting. Selection before the split reached 0.7550 on pure noise.
- Augmenting or duplicating rows before splitting. 1-NN scored 0.9600 on noise with duplicated rows.
- Splitting related rows independently. Same customer, patient or document across both sides is the same leak. Use grouped splitting.
- Tuning on the test set. Every decision made by looking at a split contaminates it; keep one split for one final measurement.
- Reporting a K-fold mean without its spread. The mean alone hides that the folds disagreed by 0.05.
- Reading a small gap as success. If both curves are low and close, the model is underfitting — the gap being small is not the goal.
- Shuffling time-series data. A shuffled split lets the model see the future. Split by time instead.
- Thirty random hold-out splits of 600 rows gave 0.7333 to 0.8750: a single split is a draw from that distribution.
- Five-fold cross-validation on the same rows had sd 0.0225 against the single split’s 0.0407, and reports its own spread.
- On 200 rows of pure noise where chance is 0.5100, selecting features before the split scored 0.7550 and duplicated rows scored 0.9600.
- The duplicate leak only appears once the split is shuffled — deduplicate, and split by group when rows are related.
- A large gap that shrinks with more data means memorising; a flattening validation curve means more data has stopped paying. Measured: gap 0.2450 → 0.0822 across 40× the data, with the last doubling buying 0.0050.
- Hold-out for large data, K-fold for thousands of rows, iterated K-fold for hundreds — plus one test set evaluated exactly once.
The mechanics of running, watching and stopping a training job — all of it built from callbacks: Callbacks and TensorBoard.
-
Thirty random 80/20 splits of the same 600 rows produced accuracies from 0.7333 to 0.8750. What does that imply about a reported single-split score?
And if you also tuned on that split, you have selected the split that flattered you. Report a K-fold mean with its spread.
pch.quizShowAnswer
B — It is one draw from a distribution 14 accuracy points wide, so it cannot support a comparison between models unless the difference is larger than that spread — And if you also tuned on that split, you have selected the split that flattered you. Report a K-fold mean with its spread.
-
On 200 rows of random features and random labels, selecting the 20 most correlated features using every row before cross-validating gave 0.7550 accuracy. Where does that come from?
The fix is a pipeline: put the selector inside the fold so it only ever sees training labels. That scored 0.5550, near the 0.5100 chance level.
pch.quizShowAnswer
B — The selection step saw the labels of the rows it would later be validated on, so the surviving features are correlated with those validation labels by construction — the lift is manufactured, not learned — The fix is a pipeline: put the selector inside the fold so it only ever sees training labels. That scored 0.5550, near the 0.5100 chance level.
-
Duplicating every row before splitting took 1-nearest-neighbour to 0.9600 on pure noise — but only with a shuffled split. Why does the shuffle matter?
Shuffling is correct practice, so the answer is not to stop shuffling — it is to deduplicate first and to split by group when rows are related.
pch.quizShowAnswer
B — With contiguous folds the two copies of a row land in the same fold, so nothing leaks; shuffling separates them, putting each test row's exact twin in the training fold — Shuffling is correct practice, so the answer is not to stop shuffling — it is to deduplicate first and to split by group when rows are related.
-
A learning curve shows training accuracy 0.9850 and validation 0.7400 at 200 rows, narrowing to 0.9367 and 0.8545 at 8,000. What is the diagnosis?
Between 4,000 and 8,000 rows validation gained only 0.0050. At that point capacity or features are cheaper levers than data collection.
pch.quizShowAnswer
B — The model is memorising and more data is the effective fix — though the validation curve is flattening, so the next doubling will buy much less than the first — Between 4,000 and 8,000 rows validation gained only 0.0050. At that point capacity or features are cheaper levers than data collection.
-
Why keep a test set that is evaluated exactly once, if you already do K-fold cross-validation?
The IMDB run measured the gap directly: 0.8882 on validation at the selected epoch against 0.8792 on the untouched test set.
pch.quizShowAnswer
B — Because every choice made by looking at the validation folds — epochs, architecture, hyperparameters — biases those folds upward, so a final untouched split is the only unbiased estimate — The IMDB run measured the gap directly: 0.8882 on validation at the selected epoch against 0.8792 on the untouched test set.
🧪 Try It Yourself
Section titled “🧪 Try It Yourself”pch.coffeeTagline
pch.coffeeCtapch.feedbackHeading
pch.feedbackSubheading