
Phase 8 - Scaling & Deploying Deep Models
Every phase before this one ended with a trained model sitting in a notebook. This phase is about the distance between that and something other people can use — and about how much of the standard advice for crossing it is hardware-specific, already applied for you, or measurably wrong on the machine in front of you.
Everything below was measured on this machine: TensorFlow 2.21, CPU only, 8 cores, no GPU. No
keras_tuner, no TensorFlow Serving binary. Those absences turned out to be useful — they forced
each page to measure the underlying mechanism rather than demonstrate an API.
What was measured
Section titled “What was measured”| Page | The claim being tested | Result |
|---|---|---|
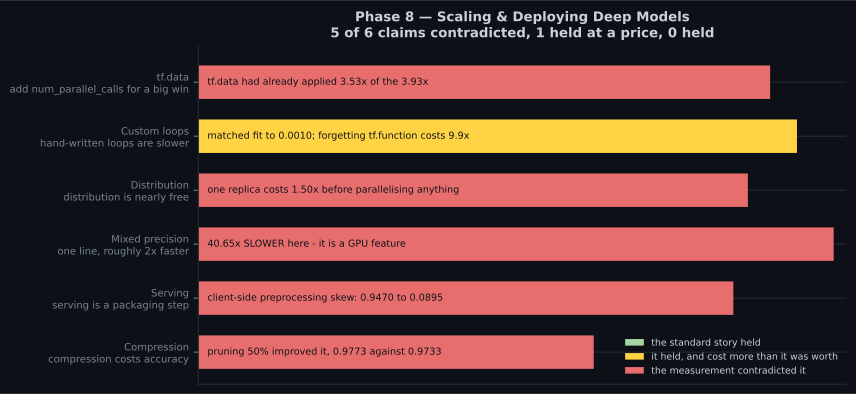
| tf.data | Add num_parallel_calls for a big win | Already applied — tf.data rewrites a stateless map for you (3.53× of the 3.93×) |
| Custom loops | Hand-written loops are slower and riskier | Matched fit to 0.0010; forgetting @tf.function costs 9.9× per step |
| tf.distribute | Distribution is nearly free | 1 replica costs 1.50× before parallelising anything; updates halve 282 → 141 |
| Hyperparameter tuning | Search strategies differ a lot | Halving found the exact best in 64 epochs; exhaustive needed 144 |
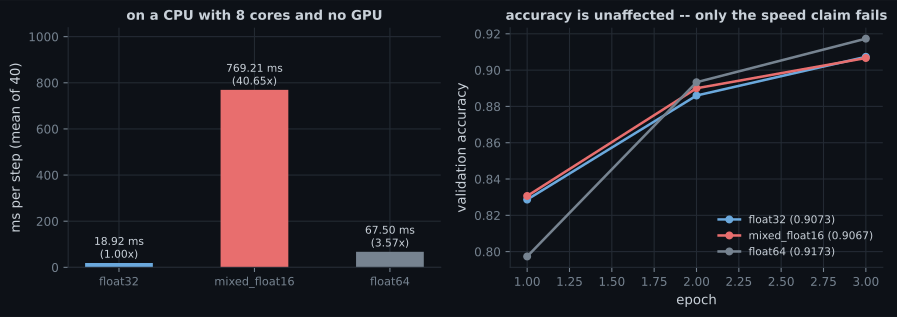
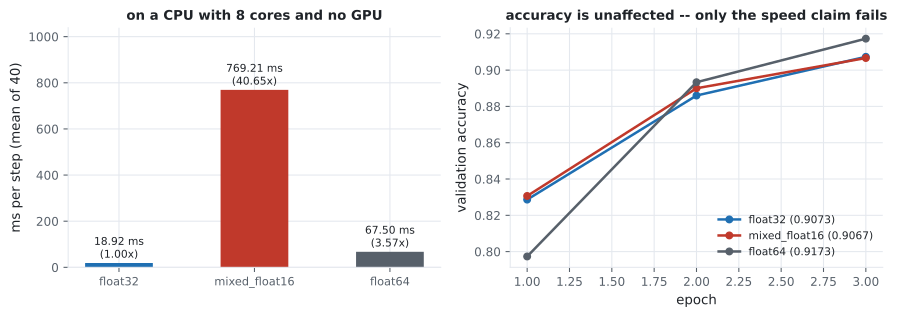
| Mixed precision | One line, roughly 2× faster | 40.65× SLOWER here — it is a GPU feature, not a model feature |
| TF Serving | Serving is a packaging step | A client preprocessing differently dropped accuracy 0.9470 → 0.0895, silently |
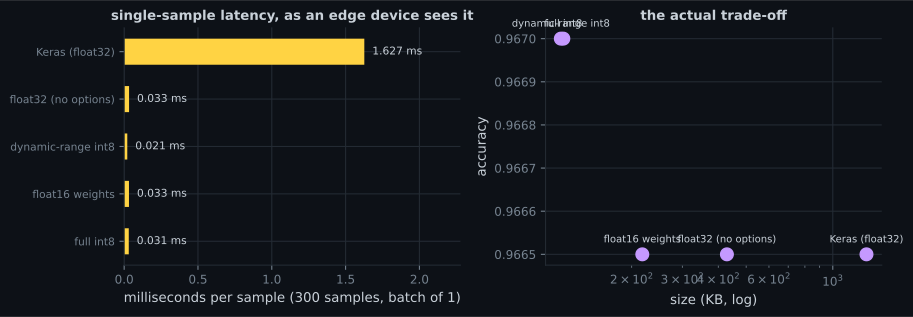
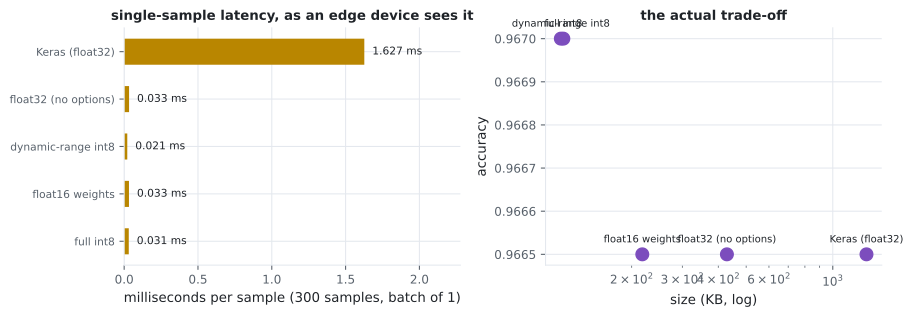
| TensorFlow Lite | Quantisation shrinks models | True (11.54×) — but conversion alone gave 3.06× and 77× lower latency |
| Model compression | Compression costs accuracy | Pruning 50% improved it (0.9773 vs 0.9733); 95% destroyed it |
| Limitations | Deep learning generalises | Measured against rotation, shift, contrast and adversarial noise |
The thread
Section titled “The thread” flowchart TD
T["a trained model"] --> F{"what is the bottleneck?"}
F -->|"data starves the step"| D["tf.data: cache 81x,
prefetch overlaps"]
F -->|"the step itself"| C["tf.function 9.9x,
distribution, precision"]
F -->|"the search"| H["halving: 64 epochs
instead of 144"]
T --> S["shipping it"]
S --> A["SavedModel: graph + weights
versioned for hot-swap"]
S --> Q["TFLite: 11.54x smaller,
77x faster at batch 1"]
S --> P["pruning and distillation"]
A -.->|"preprocessing left outside"| K["0.9470 to 0.0895,
no error raised"]
Three lessons recur across the nine pages, and they are worth stating separately from the numbers.
Most performance advice is hardware advice in disguise. Mixed precision is the clearest case — the same line that gives roughly 2× on tensor cores gave 40.65× slower here. The same is true of distribution (1.50× overhead with nothing to parallelise onto) and of float16 more generally. Measure one epoch on your own hardware before adopting any of it.
Modern frameworks already applied the tutorial. tf.data rewrote a stateless map into a
parallel one before being asked, so the classic “add num_parallel_calls” benchmark measures
almost nothing on default settings. Finding out what an option is worth now requires switching the
automatic rewrites off.
Deployment failures do not raise exceptions. A client that preprocesses differently from training returns a perfectly-shaped probability vector at 8.5% accuracy and 0.81 confidence. Quantisation changes 4 predictions in 2,000 without moving accuracy. Fine-tuning a pruned model without re-applying the mask keeps the accuracy and silently discards the sparsity. Every one of these is invisible unless something external is measuring it.
Two numbers that changed how the rest of the phase was built
Section titled “Two numbers that changed how the rest of the phase was built”model.predict() costs about 470 ms per call in a tight loop, an eager model(x) call about
28 ms, and a traced tf.function about 1.2 ms. That 390× spread decided whether several
pages in this module — and the whole reinforcement-learning phase — were runnable at all.
And per-sample inference cost falls 14× from batch 1 to batch 128. Framework overhead, not
arithmetic, dominates small-batch work; that single fact explains the TFLite latency result, the
serving batching scheduler, and why predict() is the wrong tool inside a loop.
Reading order
Section titled “Reading order”- tf.data — get data to the model faster than it consumes it.
- Custom models and training loops — replace
fitwhen you need to, and pay the tracing cost knowingly. - Distributed training — what a strategy does to your batch, your update count and your learning rate.
- Hyperparameter tuning — spend a fixed budget well.
- Mixed precision — the clearest example of hardware-dependent advice.
- TensorFlow Serving — the SavedModel contract and the skew failure it prevents.
- TensorFlow Lite — conversion, quantisation, and where the size actually goes.
- Model compression — pruning and distillation, measured against the same baseline.
- Limitations — what none of this fixes.
What this phase does not cover
Section titled “What this phase does not cover”- Real multi-GPU or TPU results. There are no accelerators here, so the pages measure semantics and overhead and say so.
- Production infrastructure. Load balancers, autoscaling, canary deployments and feature stores are all downstream of the model artefact this phase produces.
- Very large models. Everything here is MNIST-sized; sharding a model that does not fit on one device is a different problem from replicating one that does.
Each page states its own budget and hardware beside its numbers, so nothing needs to be taken on trust.
Start with Loading & Preprocessing Data with tf.data — the pipeline that feeds everything else, and the page that shows how much of its own advice the framework has already taken.
-
`mixed_float16` measured 769.21 ms per step against float32's 18.92 ms - 40.65x slower - while final accuracy moved only 0.9073 to 0.9067. What does the accuracy control establish?
pch.quizShowAnswer
B — That the float16 arithmetic is fine and only the speed claim failed - this is an 8-core CPU with no tensor cores, so the dtype conversions are pure overhead
-
A client that preprocessed differently from training dropped accuracy from 0.9470 to 0.0895 and raised no error. What class of failure is that?
pch.quizShowAnswer
B — A serving skew: the SavedModel contract covers tensor shape and dtype but not the meaning of the numbers, so a wrong-but-well-formed input returns a confident wrong answer
-
Adding `num_parallel_calls` to a stateless `map` gave only 3.93x total, of which tf.data's own automatic rewrite already supplied 3.53x. What follows for benchmarking framework advice?
pch.quizShowAnswer
B — You have to turn the automatic optimisations OFF to measure what an option is worth - otherwise you are measuring a rewrite the framework already applied
-
Pruning 50% of the weights IMPROVED accuracy (0.9773 against 0.9733) while pruning 95% destroyed it. What is the honest way to report this?
pch.quizShowAnswer
C — Moderate pruning acted as regularisation on this model and dataset, and the useful deliverable is the whole sparsity curve rather than any single point on it
-
Per-sample inference cost fell 14x from batch 1 to batch 128. Which later result does that single fact explain?
pch.quizShowAnswer
B — Why TFLite is 77x faster at batch 1, why serving needs a batching scheduler, and why `predict()` is the wrong call inside a loop
pch.coffeeTagline
pch.coffeeCtapch.feedbackHeading
pch.feedbackSubheading