
Phase 7 - Reinforcement Learning
In every phase so far the data arrived first and the model came second. Reinforcement learning inverts that: the agent’s own choices decide what data it ever sees. An action not taken teaches nothing, and a policy that settles early will keep confirming whatever it settled on.
That single property causes almost every result in this phase, including the ones that contradict the standard story.
What was measured
Section titled “What was measured”Everything ran on this machine. There is no gymnasium installed and nothing may be downloaded,
so all three environments are hand-written in scripts/figures/dl/_rl.py — a k-armed bandit, a
stochastic gridworld solvable exactly by value iteration, and a vectorised CartPole using the
same constants as the classic implementation. CartPole validates against it: a random policy
survives 23.09 steps here against the reference’s ~22.
| Page | The claim being tested | Result |
|---|---|---|
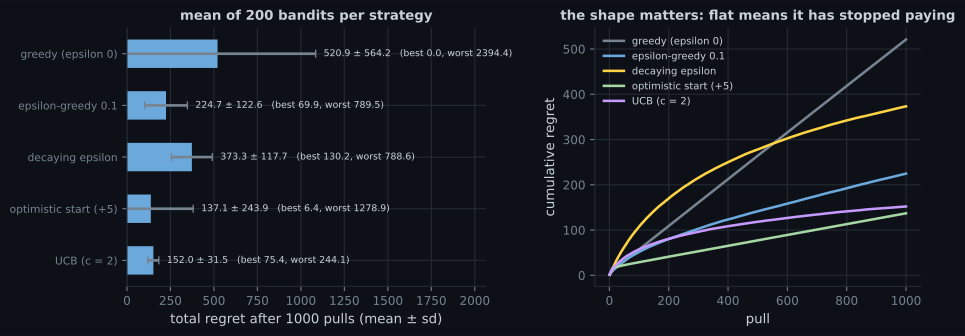
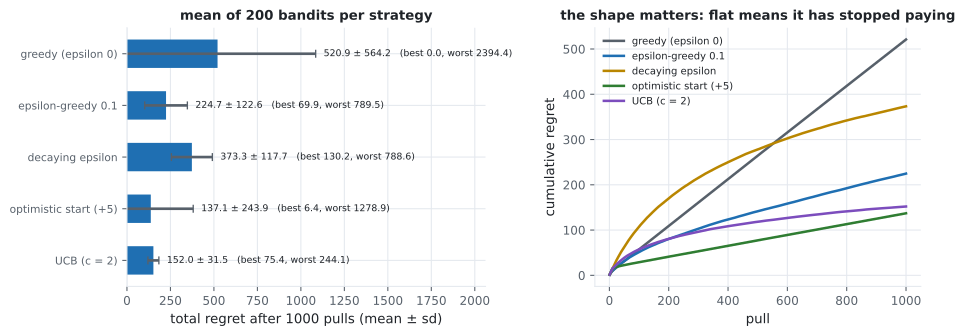
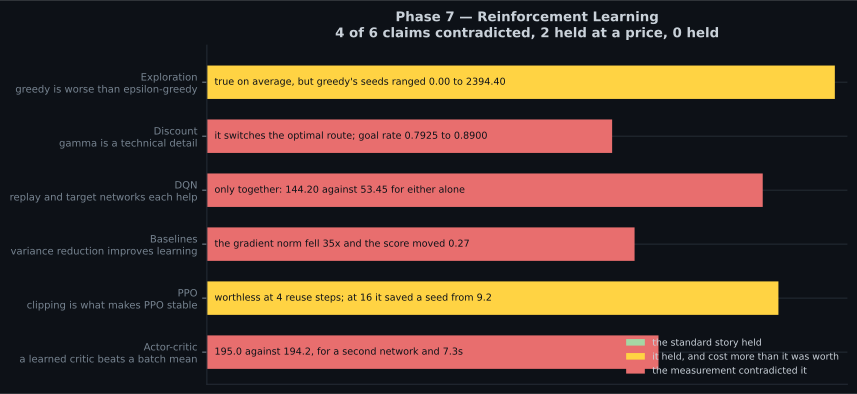
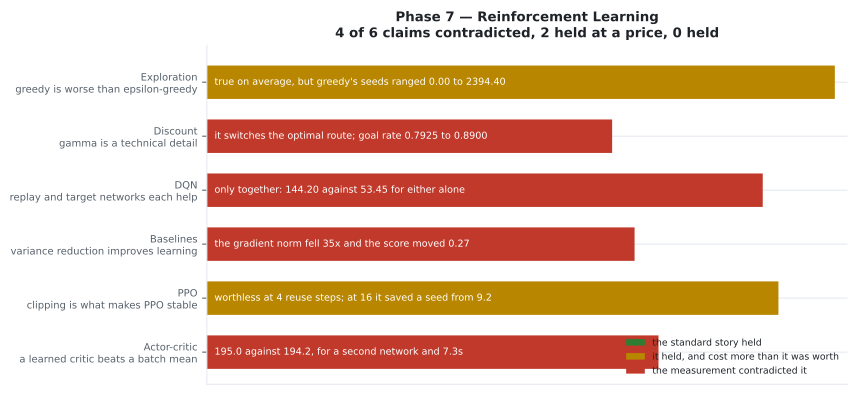
| Exploration vs exploitation | Greedy is worse than ε-greedy | True on average (520.92 vs 224.74) — but greedy’s seeds ranged 0.00 to 2394.40 |
| Introduction to RL | The discount factor is a technical detail | False — it switches the optimal route and moves the goal rate 0.7925 → 0.8900 |
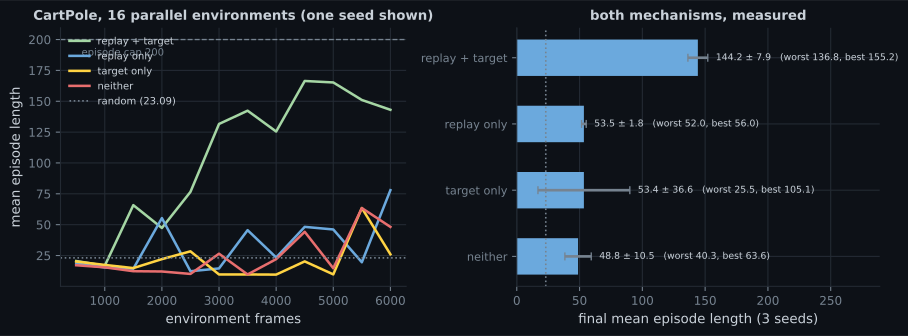
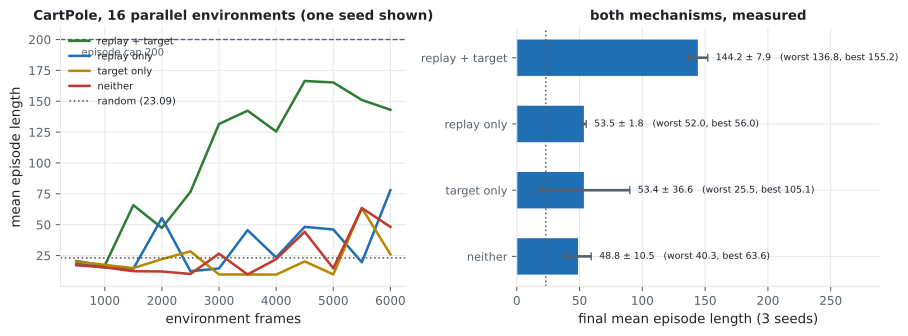
| Q-learning and DQN | Replay and target networks each help | Only together: 144.20 against 53.45 for either alone and 48.81 for neither |
| Policy gradients | A baseline improves learning | It cut the gradient norm 35× and changed the score by 0.27 |
| Actor-critic and PPO | PPO is more stable than REINFORCE | Only past 4 reuse steps — at 16 the unclipped worst seed scored 9.2, below random. Sample efficiency: 170 episodes against 544 |
The thread running through all four
Section titled “The thread running through all four”flowchart TD E["the agent chooses what data it sees"] --> B["bandit: greedy stops looking
0.32 optimal actions"] E --> G["gridworld: Q-learning never walks
the safe corridor, 0.9625 shortcut"] E --> D["DQN: correlated samples
need a replay buffer"] E --> P["REINFORCE: every return positive,
so everything is reinforced"] E --> A["PPO: reuse a batch four times,
but only inside a trust region"] A --> M B --> M["measure against a known optimum"] G --> M D --> M P --> M
Each page attacks the same problem at a different scale, and each one needs an external reference to be interpretable:
- The bandit knows its best arm, so regret is exact.
- The gridworld is small enough for value iteration, so the optimal policy is known.
- CartPole has a 200-step cap and a measured random baseline of 23.09 — which is what makes the unclipped PPO seed that scored 9.2 legible as a catastrophe rather than a low number.
Without those references, every curve in this phase would merely go up.
What went differently than expected
Section titled “What went differently than expected”Three results are worth carrying forward, because they are the kind that a plot alone would hide.
Q-learning found a worse policy than the optimum and looked converged. On the gridworld it took the risky shortcut in 96.25% of episodes where the exact solution takes it in 7.75%, scoring 0.5497 against 0.6568. Nothing about its learning curve says so — the failure is that ε-greedy almost never traverses a 12-step corridor, so the better route was never evaluated.
Low regret can mean an easy problem. ε-greedy’s regret was lowest on the hardest bandit (99.87 with arms close together, 414.38 with them far apart) because a wrong choice costs little when the arms are nearly identical. The optimal-action share tells the opposite, correct story.
Variance reduction is not the same as better learning. REINFORCE’s baseline did exactly what theory says to the gradient — 1.6992 → 0.0478 — and the final score moved 0.27. Separately, smaller batches beat larger ones at a fixed episode budget (200.00 against 173.04) despite having measurably noisier gradients.
Two engineering facts that decide whether any of this runs
Section titled “Two engineering facts that decide whether any of this runs”Both were measured while building these pages, and both matter more than any hyperparameter here:
| Way to run a batch through a network | Time per call |
|---|---|
model.predict(x) | ~470 ms |
model(x) eager | ~28 ms |
Traced tf.function | ~1.2 ms |
An RL loop makes several forward passes per environment frame, so that 390× gap is the difference between a page that runs in minutes and one that does not run at all. The same logic applies to the environment: stepping 16 CartPoles together costs one model call per timestep instead of sixteen, measured at roughly 16× faster for REINFORCE’s episode collection.
Reading order
Section titled “Reading order”- Exploration vs exploitation — the dilemma with everything else stripped away, and the reason a single run can never rank two strategies.
- Introduction to reinforcement learning — add states, and a discount factor that decides between a gamble and a detour.
- Q-learning and deep Q-networks — the tabular update, why a network breaks it, and an ablation of the two mechanisms that repair it.
- Policy gradients — skip the value function entirely and pay for it in variance.
- Actor-critic and PPO — put a learned value function back in as a baseline, then make it safe to take four gradient steps on one batch instead of one.
What this phase does not cover
Section titled “What this phase does not cover”- Pixel-based environments. Everything here uses low-dimensional state vectors, so no convolutional encoder is involved and none of the Atari-scale engineering appears.
- Long-horizon or sparse-reward tasks. CartPole’s reward is dense and its episodes are capped at 200 steps, which is precisely why the REINFORCE baseline had no room to show a benefit.
Each page states its own budget beside its numbers, so nothing here needs to be taken on trust.
Start with Exploration vs Exploitation — ten levers, a thousand pulls, and the measurement that every later page depends on.
-
A DQN with a replay buffer alone reached 53.45 and with a target network alone reached 53.45, against 48.81 for neither and 144.20 for both. What does that pattern mean?
pch.quizShowAnswer
C — Each mechanism only pays off once the other has removed a different failure — their effects are not additive
-
Every environment in this phase is hand-written in `_rl.py` rather than imported from a library. Why does the phase check that a random CartPole policy survives 23.09 steps?
pch.quizShowAnswer
B — Because a hand-written environment has to be validated against the reference implementation before any result measured in it means anything
-
ε-greedy scored its LOWEST regret (99.87) on the bandit whose arms were closest together, and its highest (414.38) when they were far apart. What is going on?
pch.quizShowAnswer
B — Regret measures reward lost per wrong choice, and when the arms are nearly identical a wrong choice costs almost nothing — low regret here means low stakes, not good behaviour
-
Q-learning on the gridworld took the risky shortcut in 96.25% of episodes where the exact solution takes it in 7.75%, and its learning curve looked converged. What caused it?
pch.quizShowAnswer
C — ε-greedy almost never strings together the 12 steps needed to traverse the safe corridor, so the better route was never evaluated — the agent's own policy decided what data existed
-
`model.predict(x)` measured ~470 ms per call, eager `model(x)` ~28 ms, and a traced `tf.function` ~1.2 ms. Why does this decide whether an RL page exists at all?
pch.quizShowAnswer
B — An RL loop makes several forward passes per environment frame and needs thousands of episodes, so a 390× per-call gap is the difference between minutes and days
pch.coffeeTagline
pch.coffeeCtapch.feedbackHeading
pch.feedbackSubheading