
Phase 9 - Capstone Projects
The eight phases before this one each isolated a mechanism. This one puts the whole thing together three times, on three problems that fail in three different ways — and in every case the deliverable is not the model. It is the evidence that the model works, in a form someone sceptical can check.
Everything below was measured on this machine: TensorFlow 2.21, Keras 3.15, CPU only, 8 cores.
The three projects
Section titled “The three projects”| Capstone | Problem | What it turns out to be about |
|---|---|---|
| 1 — An image classifier | Fashion-MNIST, 12,000 train / 3,000 held out | A ladder that climbs, and the rung whose gain is negative |
| 2 — A text classifier | IMDB sentiment, 6,000 train / 3,000 held out | A ladder that stops at rung three and what to report when it does |
| 3 — A generative model | MNIST, a VAE with an 8-dimensional latent space | A result with no accuracy column, and the adversary it has to survive |
What each one measured
Section titled “What each one measured”Capstone 1 built six rungs from a constant predictor to a deployed TFLite artefact:
| Rung | Accuracy | Gain |
|---|---|---|
| Always predict one class | 0.0993 | — |
| Nearest class centroid | 0.6713 | +0.5720 |
| Linear (softmax) | 0.8290 | +0.1577 |
| MLP | 0.8603 | +0.0313 |
| Convnet | 0.8773 | +0.0170 |
| Convnet + augmentation | 0.8643 | −0.0130 |
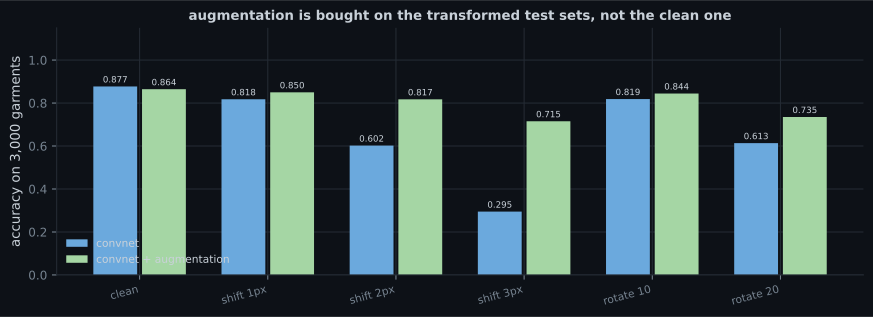
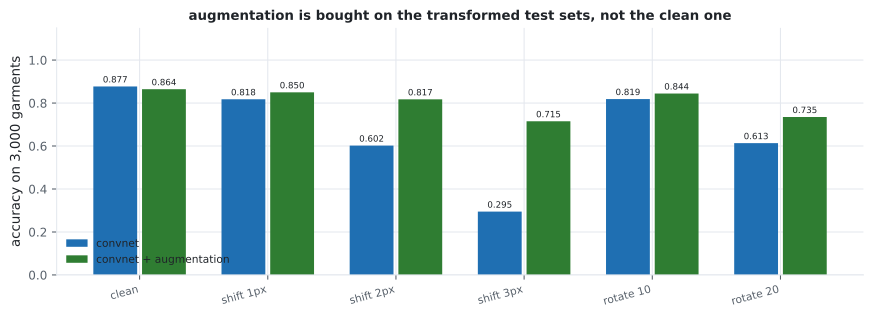
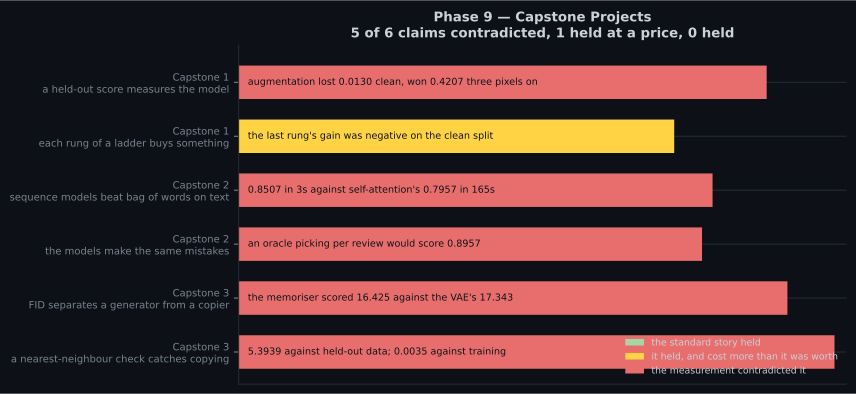
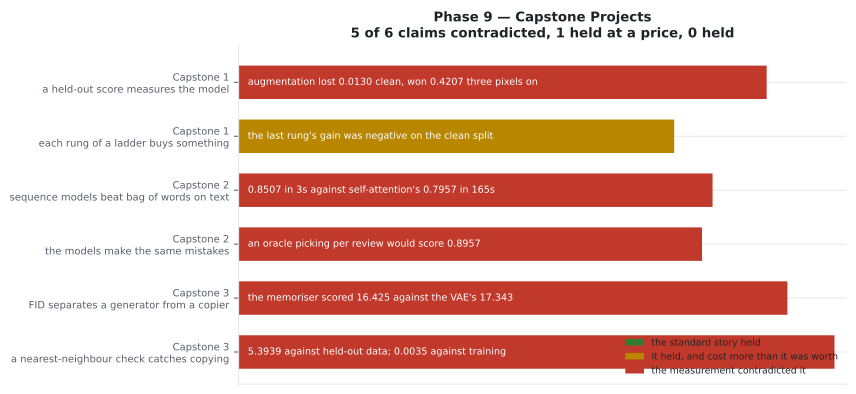
The last row is the finding. Augmentation cost 0.0130 on the clean test set and gained 0.4207 on the same test set shifted three pixels — 0.2947 against 0.7153. A single held-out number said the change was bad; six of them said the opposite.
Capstone 2 built the same kind of ladder on text and watched it stop:
| Model | Seconds | Accuracy |
|---|---|---|
| Bag of words + linear | 3 | 0.8507 |
| Embedding + pooling | 6 | 0.8587 |
| LSTM | 53 | 0.8353 |
| Bidirectional LSTM | 113 | 0.7887 |
| Self-attention | 165 | 0.7957 |
A linear model with no word-order information at all beat every sequence model, at 18× to 55× less training time. The page’s job is then to say why — 6,000 examples, 6 epochs, a 200-token window truncating 43.3% of reviews — so the result reads as a claim about the budget rather than a claim about recurrence.
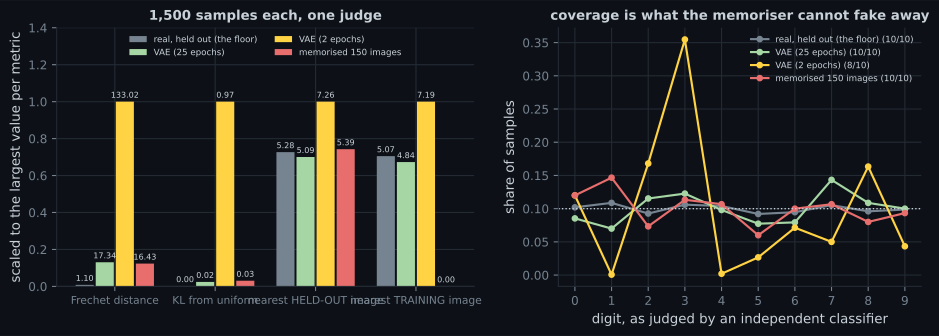
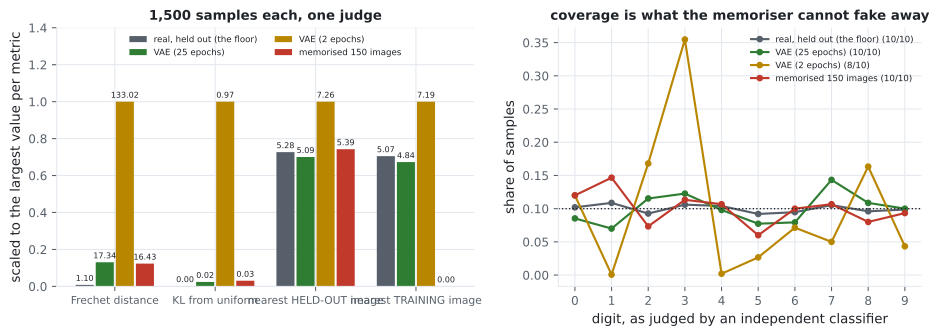
Capstone 3 removed the accuracy column entirely. A VAE produces images; there is no label to score them against. So the evaluation itself became the deliverable, and it was tested against a twelve-line adversary that copies 150 training images and generates nothing:
| Source | Fréchet | KL from uniform | Nearest training |
|---|---|---|---|
| Real, held out (floor) | 1.101 | 0.0016 | 5.0696 |
| VAE, 25 epochs | 17.343 | 0.0234 | 4.8392 |
| Memorised, 150 images | 16.425 | 0.0294 | 0.0035 |
The memoriser beat the real model on Fréchet distance and tied it on coverage. Only the distance to the training split exposed it — and the first version of that check, run against held-out data, ranked the memoriser as the least suspicious source of the three.
The thread
Section titled “The thread”flowchart TD P["a problem"] --> B["a baseline you can beat
0.0993, 0.5220, or a real-data floor"] B --> L["a ladder of models,
each measured against the rung below"] L --> N{"did the gain
justify the cost?"} N -->|"capstone 1"| A["yes, but only off
the clean distribution"] N -->|"capstone 2"| S["no - it stopped at
rung three"] L --> E["capstone 3: no accuracy exists,
so build the evaluation"] E --> D["and attack it with
a model that cheats"]
Three habits recur across all three pages, and they are the transferable part.
A number needs a floor. 0.8773 means nothing without 0.0993 beside it; 17.343 means nothing without 1.101. Every capstone starts by measuring the cheapest thing that could possibly work, because that is what makes every later number readable.
One test set answers one question. Augmentation looked like a regression on clean data and a 0.4207 improvement three pixels away. The IMDB ladder looked flat until reviews were bucketed by length. A single held-out score is a measurement of one distribution, not a property of the model.
Report the rungs that lost. The negative gain, the LSTM that came fourth, the metric the memoriser won — those are the results that let someone else trust the ones that went your way.
Where to go next
Section titled “Where to go next”The capstones are the end of the module. If you want to keep going, the two directions with the most immediate return are the ones this module could only gesture at: pretrained models, which remove the most expensive part of every project here (learning representations from scratch, on 6,000 examples), and GPU access, which changes the feasible experiment size by an order of magnitude and makes several of Phase 8’s negative results — mixed precision at 40.65× slower, distribution at 1.50× overhead — flip sign.
Back to the Deep Learning overview.
-
Augmentation cost 0.0130 on the clean test set and gained 0.4207 on the same test set shifted three pixels. What does that say about single-number evaluation?
pch.quizShowAnswer
B — A held-out score measures one distribution, not a property of the model - and the distribution you measured may not be the one you deploy on
-
On IMDB, a bag of words scored 0.8507 in 3 seconds and self-attention 0.7957 in 165. What does capstone 2 do with that instead of stopping at 'the LSTM lost'?
pch.quizShowAnswer
B — States the budget - 6,000 examples, 6 epochs, a 200-token window truncating 43.3% of reviews - so the result reads as a claim about this budget rather than about recurrence
-
Capstone 3's memoriser copied 150 training images and beat the real VAE on Frechet distance (16.425 against 17.343). Why did the first memorisation check fail to catch it?
pch.quizShowAnswer
B — It compared against held-out data while the memoriser copied training data - so its samples were ordinary unseen digits by that measure, scoring 5.3939 against the VAE's 5.0886
-
Every capstone begins by measuring the cheapest thing that could possibly work - 0.0993, 0.5220, or a real-data floor of 1.101. Why?
pch.quizShowAnswer
B — Because a number is only readable against a floor: 0.8773 means nothing without 0.0993, and 17.343 means nothing without 1.101
-
Capstone 1's ladder has a NEGATIVE last rung and capstone 2's ladder stops climbing at rung three. Why are both reported rather than trimmed?
pch.quizShowAnswer
B — Because the losing rungs are the findings - they say where the returns ran out on this data, which is exactly what someone repeating the work needs to know
pch.coffeeTagline
pch.coffeeCtapch.feedbackHeading
pch.feedbackSubheading